Contents

Overview
The concept of natural capital has come to be as important as ecosystem services in shaping how we now understand natural systems. Just as the fundamental measures of national economic wealth and performance include the value of physical capital like buildings (or fishing boats) it now recognized that natural capital must be part of our understanding of economic systems. Classifying ecosystems as natural capital is essential to changing wetlands from wastelands to capital assets. The importance of this approach has been recognized by both national governments and by international organizations. Valuing ecosystems as capital and restoring them creates powerful returns on investment in the form of sustainable economic growth.
In strictly economic terms, the value of an ecosystem is a function of its physical characteristics, the way in which the wetland produces services, the points in the economic system where measurement of the values is made and whether its value should be considered as a set of flows per period or the present value of flows over some future periods. With this foundation it is now possible to identify the key economic concepts used to define and measure the economic values of the natural capital assets of natural environments and their associated ecosystem services.
When evaluating the value of natural capital and ecosystem services, the most common starting point is the distinction between “market” and “nonmarket” values. Market values are those determined by exchanges in which buyers and sellers trade goods and services for payment. The payments (prices and quantities) are readily observable. But not all ecosystem services are traded in markets; most, in fact, are not. Thus, there is an additional set of “nonmarket” values that must be measured. These values are measured by considering economic welfare as well as economic activity. Economic activity generally accounts for only a small part of value of natural capital. Economic welfare describes the level of benefit that accrues to those who enjoy the services provided by ecosystems.
Ecosystems services are the benefits provided by healthy ecosystems. They include the following:
- Clean air and water
- Carbon sequestration
- Waste decomposition and removal
- Regulation of pests
- Hazard Regulation—Flood control
- Provisioning Services
- Food such as seafood and game
- Raw materials such as timber and fibers
- Genetic resources
- Medicinal and Pharmaceutical materials
- Energy such as hydropower
- Cultural Services
- Recreation and Tourism
- Spiritual Practices and Location
- Aesthetic—Natural Beauty
- Flood Control
- Carbon Storage
- Climate Regulation Erosion Control
NOEP currently focuses on flood protection services provided by coastal wetlands and the value of coastal and ocean ecosystem carbon storage or Blue Carbon.
Natural Infrastructure:
Natural infrastructure is an example of natural capital. The National Oceanic and Atmospheric Administration defines natural infrastructure as healthy ecosystems which provide multiple benefits to communities. The two types of infrastructure considered by this study are flood protection and Blue Carbon.
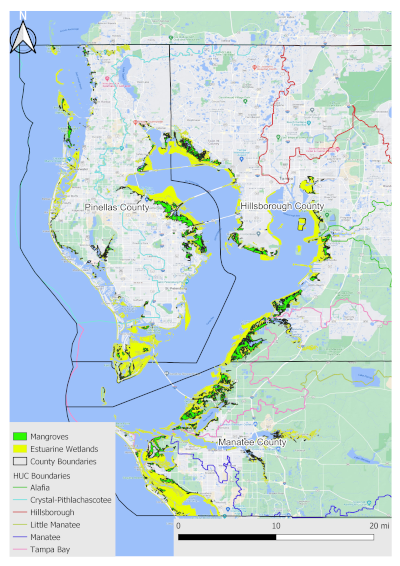
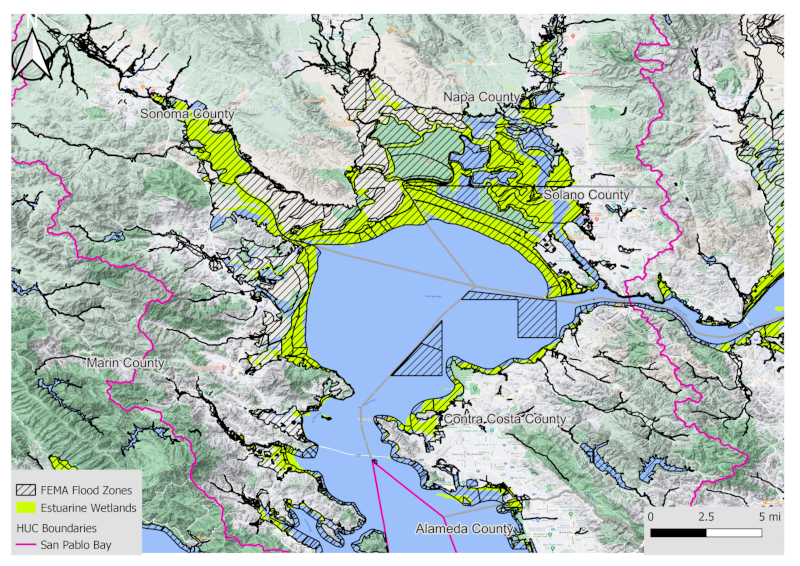
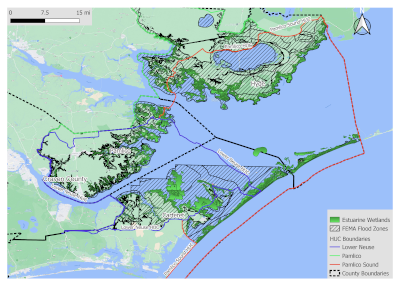
Wetland ecosystems such as saltmarshes and mangroves help protect coastal communities from flooding, by acting as buffers which attenuate waves from coastal storms and absorb the incoming water. Estuarine wetlands can reduce the impact of storms by as much as 20%. Thus, intact wetlands are economically valuable resources strictly in terms of avoided costs and reduced impacts.
The data presented here on Blue Carbon and Flood Protection comes from a recent report on the economic value of US estuaries by the Center for the Blue Economy
The Economic Value of America’s Estuaries: 2021 Report, Tracy Rouleau, Charles S. Colgan, Jefferey Adkins, Castelletto Anthony, Dirlam Patty, Shannon Lyons, and Hilary Stevens
Blue Carbon:
Coastal ecosystems such as mangroves, saltmarshes, and seagrass beds sequester vast amounts of carbon, acting as carbon sinks. They store carbon taken up from atmospheric carbon dioxide in their soils for extended periods of time and cycle back into the living habitat. The carbon stored by estuary and other marine ecosystems is called Blue Carbon. Thus, the ongoing loss of wetlands to human activity increases the danger posed by climate change.
Blue Carbon and Natural Infrastructure in Selected U.S. Estuaries (Totals)
| Wetlands Area (Hectares) | Natural Infrastructure | Coastal Blue Carbon | Total Natural Infrastructure and Blue Carbon | ||||||
| Natural Infrastructure | Coastal Blue Carbon | Lowest Estimate | Highest Estimate | Lowest Estimate | Highest Estimate | Lowest Estimate | Highest Estimate | ||
| Total ($Millions) | |||||||||
| Great Egg Harbor | 3,600 | 24,439 | $34.10 | $153.60 | $63.60 | $366.90 | $97.70 | $520.50 | |
| Pamlico Sound | 62,153 | 37,000 | $48.80 | $219.80 | $124.80 | $720.20 | $173.60 | $940.00 | |
| Tampa Bay | 34,377 | 6,652 | $902.00 | $2,705.10 | $7.70 | $44.20 | $909.70 | $2,749.30 | |
| Terrebonne Basin | N/A | 133,462 | N/A | N/A | $430.00 | $2,482.60 | $430.00 | $2,482.60 | |
| San Pablo Bay | 29,872 | 8,451 | $15.40 | $68.70 | $15.90 | $91.50 | $31.30 | $160.20 | |
| Snohomish Estuary | 906 | 189 | $0.70 | $3.40 | $0.20 | $1.40 | $0.90 | $4.80 | |
| TOTAL | 130,908 | 210,193 | $1,001.00 | $3,150.60 | $642.20 | $3,706.80 | $1,946.00 | $8,118.70 | |
Blue Carbon in Selected U.S. Estuaries (Per Hectare)
| Wetlands Area (Hectares) | Natural Infrastructure | Coastal Blue Carbon | ||||
| Natural Infrastructure | Coastal Blue Carbon | Lowest Estimate | Highest Estimate | Lowest Estimate | Highest Estimate | |
| Dollars Per Hectare ($Thousands) | ||||||
| Great Egg Harbor | 3,600 | 24,439 | $9.60 | $42.70 | $2.60 | $15.00 |
| Pamlico Sound | 62,153 | 37,000 | $0.80 | $3.50 | $3.40 | $19.50 |
| Tampa Bay | 34,377 | 6,652 | $26.20 | $78.70 | $1.20 | $6.60 |
| Terrebonne Basin | N/A | 133,462 | N/A | N/A | $3.20 | $18.60 |
| San Pablo Bay | 29,872 | 8,451 | $0.50 | $2.30 | $1.90 | $10.80 |
| Snohomish Estuary | 906 | 189 | $0.80 | $3.80 | $1.30 | $7.50 |
Flood Protection Benefits Selected U.S. Estuaries
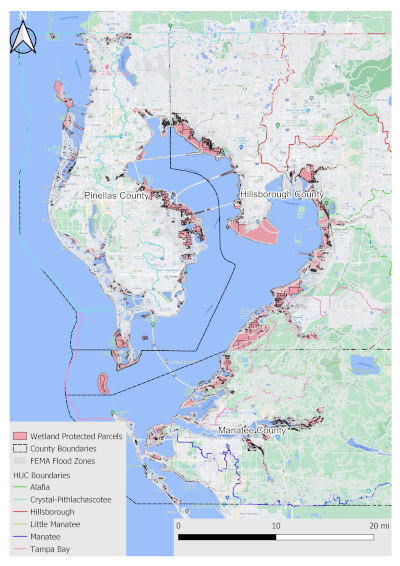
Coastal wetlands and mangroves protect coastal real estate against the threat of flooding from storm surge and king tides. They do so by absorbing wave energy, slowing down water flows, and even by absorbing water. The tables below show the flood protection value of these estuarine wetlands for selected US estuaries.
Tampa Bay
|
|
|
1% Annual Probability Storm Benefits (Millions) |
2% Annual Probability Storm Benefits (Millions) |
||
Wetlands Area (Ha) |
Number of wetlands-adjacent parcels in 100 Year Flood Zone |
Values at Risk (Millions) | Wetland Effect | Wetland Effect |
Wetland Effect | Wetland Effect |
Low | High |
Low |
High |
|||
-10% |
-20% |
-20% | ||||
27049 |
147768 |
$182,044.62 |
$688.25 |
$1,548.55 |
$1,376.49 |
$3,097.11 |
 |
 |
|
|
|
|
|
|
|
|
|
||||||||||||
|
|
|
|
|
|
1% Annual Probability Storm Benefits (Millions) |
2% Annual Probability Storm Benefits (Millions) |
|
|
|
|
|
|
|
|
|
||||
|
|
Parcels |
Buildings Value |
Land Value |
Total Value |
Wetland Effect |
Wetland Effect |
Wetland Effect |
Wetland Effect |
|
|
|
|
|
|
|
|
| ||
|
(Millions) |
(Millions) |
(Millions) | Low |
High | Low |
High |
|
|
|
|
|
|
|
|
| ||||
|
|
|
| -10% |
-20% | -10% |
-20% |
|
|
|
|
|
|
|
|
| ||||
| Hillsborough | 14,578.00 |
$5,876.41 |
$3,353.41 |
$9,229.82 |
$34.91 |
$78.54 | $69.81 | $157.07 |
|
|
|
|
|
|
|
|
| ||
|
Manatee |
47,611.00 |
$118,784.26 |
$45,010.10 |
$163,794.36 |
$619.61 |
$1,394.12 |
$1,239.22 |
$2,788.24 |
|
|
|
|
|
|
|
|
|
||
| Pinellas |
85,579.00 |
$4,680.62 |
$4,339.83 |
$9,020.44 |
$33.73 |
$75.90 |
$67.46 |
$151.79 |
|
|
|
|
|
|
|
|
|
||
|
TOTAL |
147,768.00 |
$129,341.29 |
$52,703.33 | $182,044.62 | $688.25 |
$1,548.55 |
$1,376.49 |
$3,097.11 |
|
|
|
|
|
|
|
|
|
||
|
|
|
1% Annual Probability Storm Benefits (Millions) |
2% Annual Probability Storm Benefits (Millions) |
||
Wetlands Area (Ha) |
Number of mangrove-adjacent parcels |
Values at Risk (Millions) |
Wetland Effect |
Wetland Effect |
Wetland Effect |
Wetland Effect |
Low |
High |
Low | High |
|||
-10% |
-20% |
-10% |
-20% |
|||
7328.34 |
9,313 |
$49.48 | $285.11 |
$645.51 |
$570.23 |
$1,283.02 |
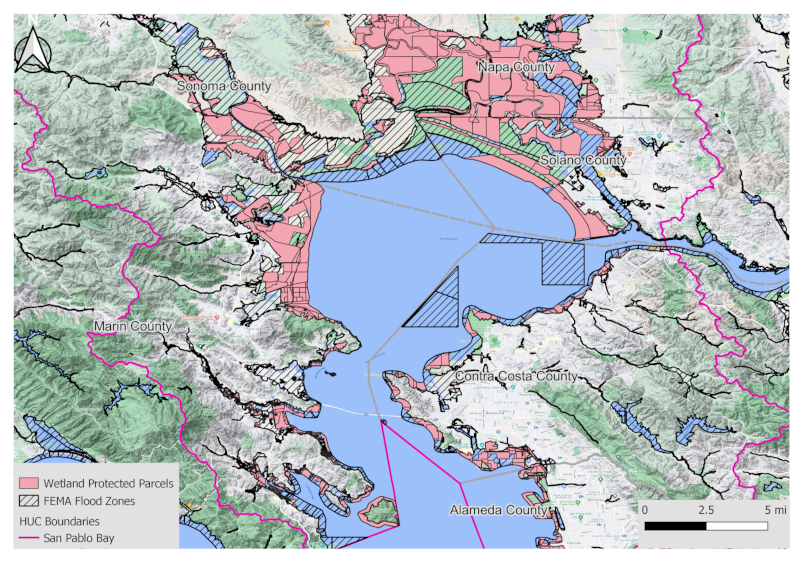
San Pablo Bay
|
|
|
1% Annual Probability Storm Benefits (Millions) |
2% Annual Probability Storm Benefits (Millions) |
||
Wetlands Area (Ha) |
Number of wetlands-adjacent parcels in 100 Year Flood Zone |
Values at Risk (Millions) | Wetland Effect | Wetland Effect | Wetland Effect | Wetland Effect |
Low |
High | Low |
High |
|||
-10% |
-20% |
-10% |
-20% |
|||
29,872 |
4,925 |
$5,986 |
$26.25 |
$59.064 |
$52.50 | $118.13 |
 |
 |
|
|
|
|
|
|
|
|
|
||||||||||||
|
|
|
|
|
|
1% Annual Probability Storm Benefits (Millions) |
2% Annual Probability Storm Benefits (Millions) |
|
|
|
|
|
|
|
|
|
||||
|
|
Parcels |
Buildings Value |
Land Value |
Total Value |
Wetland Effect |
Wetland Effect |
Wetland Effect |
Wetland Effect |
|
|
|
|
|
|
|
|
|
||
|
(Millions) |
(Millions) |
(Millions) |
Low |
High |
Low |
High |
|
|
|
|
|
|
|
|
|
||||
|
|
|
|
-10% |
-20% |
-10% |
-20% |
|
|
|
|
|
|
|
|
|
||||
|
Alameda |
1472 |
$515.67 |
$270.27 |
$785.95 |
$3 |
$6.53 |
$5.80 |
$13.05 |
|
|
|
|
|
|
|
|
|
||
|
Contra Costa |
142 |
$2,648.25 |
$486.25 |
$3,134.50 |
$15.73 |
$35.39 |
$31.46 |
$70.79 |
|
|
|
|
|
|
|
|
|
||
|
Marin |
213 |
$724.79 |
$1,017.48 |
$1,742.27 |
$6.44 |
$14.50 |
$12.89 |
$29.00 |
|
|
|
|
|
|
|
|
|
||
|
Napa |
2150 |
$14.43 |
$38.03 |
$52.46 |
$0.11 |
$0.25 |
$0.22 |
$0.50 |
|
|
|
|
|
|
|
|
|
||
|
Sonoma |
343 |
$ 99.02 |
$40.58 |
$139.60 |
$1.79 |
$2.01 |
$1.79 |
$4.03 |
|
|
|
|
|
|
|
|
|
||
|
Solano |
154 |
$18.31 |
$113.68 |
$131.68 |
$0.34 |
$0.38 |
$0.34 |
$0.77 |
|
|
|
|
|
|
|
|
|
||
|
TOTAL |
4474 |
$ 4,020.47 |
$1,965.98 |
$5,986.45 |
$27.32 |
$59.06 |
$52.50 |
$118.13 |
|
|
|
|
|
|
|
|
|
||
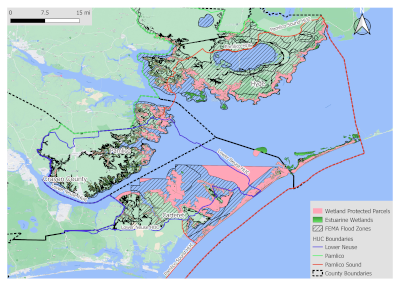
Pamlioco Sound
Table XI‑1 Summary of Findings: Pamlico Sound Estuary Natural Infrastructure Benefits |
||||||
|
|
|
1% Annual Probability Storm Benefits (Millions) |
2% Annual Probability Storm Benefits (Millions) |
||
Wetlands Area (Ha) |
Number of wetlands-adjacent parcels in 100 Year Flood Zone |
Values at Risk (Millions) |
Wetland Effect |
Wetland Effect |
Wetland Effect |
Wetland Effect |
Low |
High |
Low |
High |
|||
-10% |
-20% |
-10% |
-20% |
|||
62,152.81 |
35,429 |
$15,021 |
$45.86 |
$103.19 |
$91.73 |
$206.38 |
 |
 |
|
|
|
|
|
1% Annual Probability Storm Benefits (Millions) |
2% Annual Probability Storm Benefits (Millions) |
||
|
Parcels |
Buildings Value |
Land Value |
Total Value |
Wetland Effect |
Wetland Effect |
Wetland Effect |
Wetland Effect |
(Millions) |
(Millions) |
(Millions) |
Low |
High |
Low |
High |
||
|
|
|
-10% |
-20% |
-10% |
-20% |
||
CARTERET |
23,293 |
3,640.08 |
8,569.90 |
12,209.98 |
$38.42 |
$86.45 |
$76.85 |
$172.91 |
CRAVEN |
55 |
5.17 |
12.33 |
17.50 |
$0.04 |
$0.09 |
$0.08 |
$0.17 |
HYDE |
3475 |
210.28 |
1,518.88 |
1,729.16 |
$3.89 |
$8.76 |
$7.79 |
$17.52 |
PAMLICO |
8,606 |
540.03 |
523.85 |
1,063.89 |
$3.51 |
$7.89 |
$7.01 |
$15.78 |
TOTAL |
35,429 |
4,395.57 |
10,624.96 |
15,020.53 |
$45.86 |
$103.19 |
$91.73 |
$206.38 |
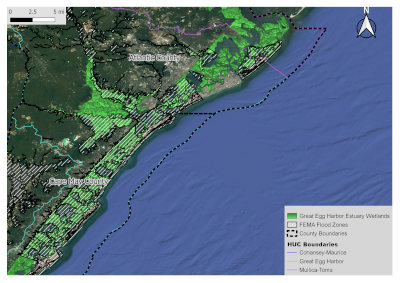
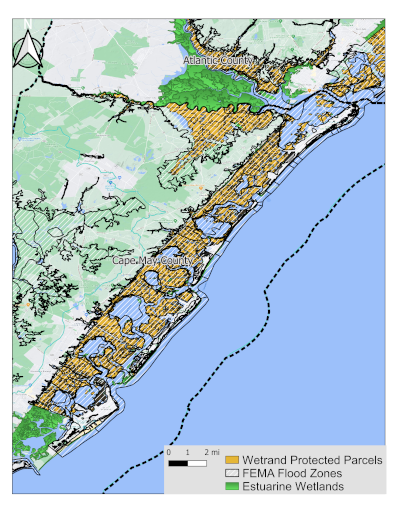
Great Egg Harbor
|
|
|
1% Annual Probability Storm Benefits (Millions) |
2% Annual Probability Storm Benefits (Millions) |
||
Wetlands Area (Ha) |
Number of wetlands-adjacent parcels in 100 Year Flood Zone |
Values at Risk (Millions) |
Wetland Effect Low (10%) |
Wetland Effect High (20%) | Wetland Effect Low (10%) |
Wetland Effect High (20%) |
30020 |
18,743 |
$13,416 |
$33.00 |
$74.21 |
$65.97 |
$148.42 |
 |
 |
|
|
|
|
|
1% Annual Probability Storm Benefits (Millions) |
2% Annual Probability Storm Benefits (Millions) |
||
|
Parcels |
Buildings Value (Millions) |
Land Value (Millions) |
Total Value (Millions) |
Wetland Effect Low (10%) |
Wetland Effect High (20%) |
Wetland Effect Low (10%) |
Wetland Effect High (20%) |
Atlantic County |
3,520 |
$705.11 |
$1503.02 |
$2,208.13 |
$5.29 |
$11.90 |
$10.58 |
$23.80 |
Cape May County |
15,223 |
$3259.33 |
$7848.84 |
$11,208.17 |
$28.85 |
$64.91 |
$57.70 |
$129.82 |
TOTAL |
18,743 |
$3,964.44 |
$9,451.86 |
$13,416.30 |
$34.14 |
$ 76.81 |
$ 68.28 |
$ 153.62 |